DataEQ has analysed consumer sentiment towards leading Saudi brands in telco, banking and retail industries during the month of Ramadan. In this final report, we examined customer experience for three Saudi Arabian grocery retailers, Danube, Othaim Markets, and Panda. DataEQ analysed public tweets from 24 April - 22 May 2020.
Othaim had the largest share of voice and Danube had the highest proportion of COVID-19 conversation
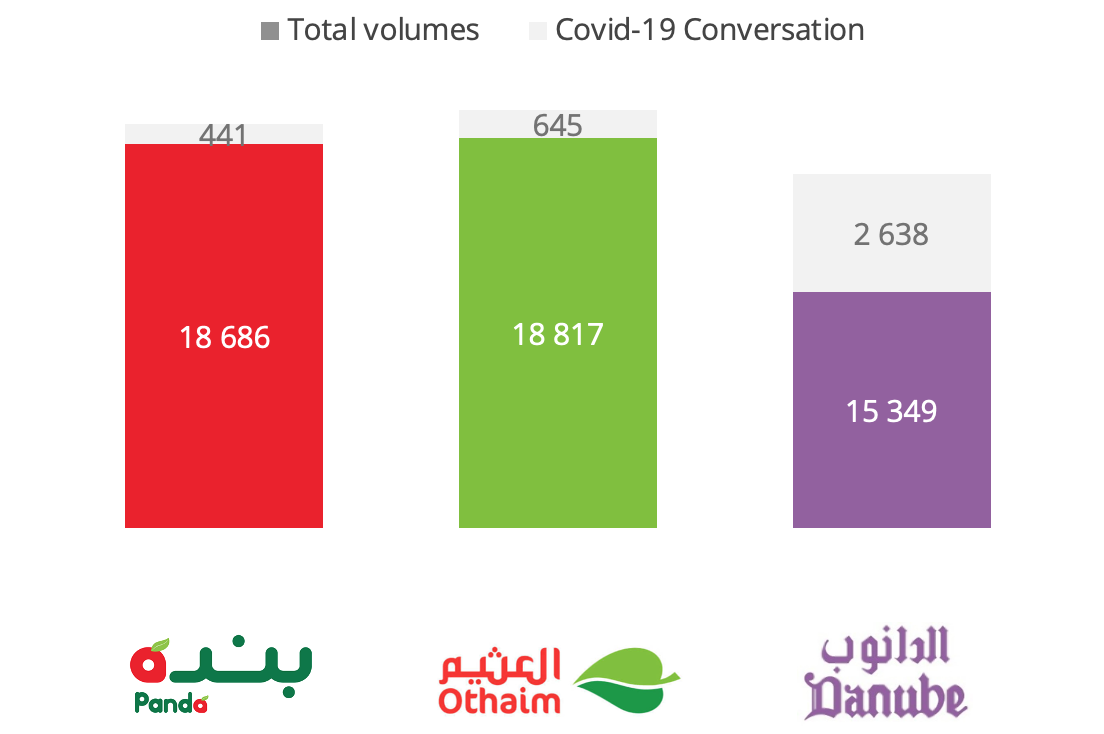
Share of the public Twitter conversation from 24 April - 22 May 2020
Panda had the highest response rate and the fastest response time for public responses on Twitter
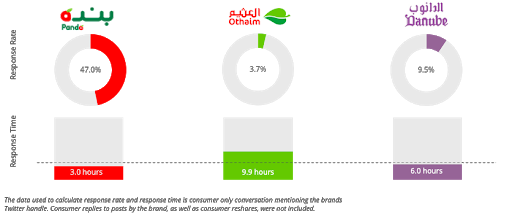 Response rate and response time for each retailer
The retail industry in Saudi produced a -15.5% Net Sentiment average during Ramadan. Panda had a Net Sentiment of -24.9%, the lowest of all brands. This was mostly linked to customer complaints around service. Danube had the second-highest Net Sentiment score of -12.1%. Danube also received the most positive referrals by customers. Othaim had the highest Net Sentiment of -10.2%.
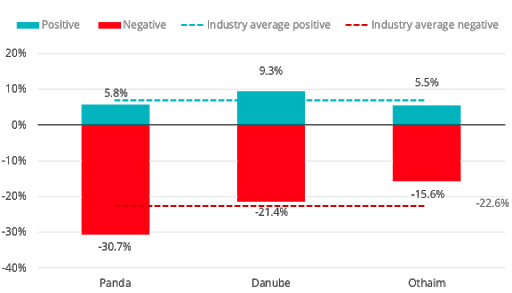 Sentiment per retailer
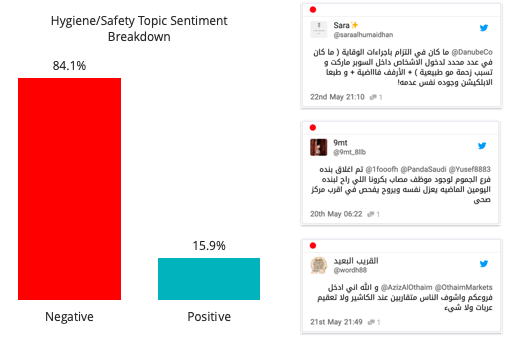
In-store health and safety was a priority for customers
Consumers have become very conscious of store hygiene and well-being during the Covid-19 crisis. Physical safety and hygiene featured in 22.9% of the conversation in Ramadan for all retailers. 84.1% of this conversation were complaints. Consumers were concerned that retailers were not doing enough to protect customers in-store and sought assurances that retailers would provide security and comfort in their shopping experience. These demands impact everything from entering a store and interacting with stock to queuing and paying for in-store and home deliveries.
Complaints comprised 22.8% of the retail industry’s Twitter conversation
22.8% of the total consumer Twitter conversations were complaints. Retail facilities were the largest contributor to the industry’s negative conversation. Retail facilities are consumer-facing touchpoints operated by brands such as stores, mobile applications and online ordering services.
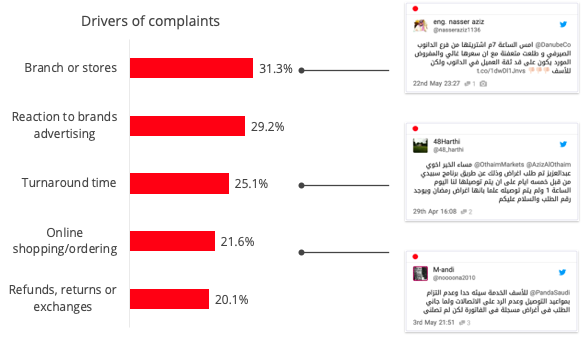
The main customer complaints during Ramadan were about the lack of stock, long delivery times and false advertising.
Complaints about branches or stores comprised 31.3% of complaints. Most of these complaints linked to items being out of stock.
29.2% of complaints came as a reaction to brand advertising. Consumers took the opportunity to highlight false advertising on brand tweets and criticised retailers for advertising products that were no longer in stock.
Poor turnaround time accounted for 25.1% of complaints. This had a strong co-occurrence with online shopping. Consumers frequently complained about the delays in the delivery of items ordered online, and delays in resolving online issues.
Online delivery services was a key pain point for customers across the entire process
Online shopping and delivery services received numerous complaints. Throughout Ramadan, consumers complained about brands not being able to meet their expectations and were unsatisfied about backlogs and deliveries that were late or had gone missing.
87.7% of refund conversation was about Danube, 97% of which were complaints. The complaints were mostly linked to refunds that were not fulfilled and slow customer service for refunds and online orders. Some alleged that the brand was refusing to compensate for late or missing deliveries or was deliberately stalling the process.
Methodology
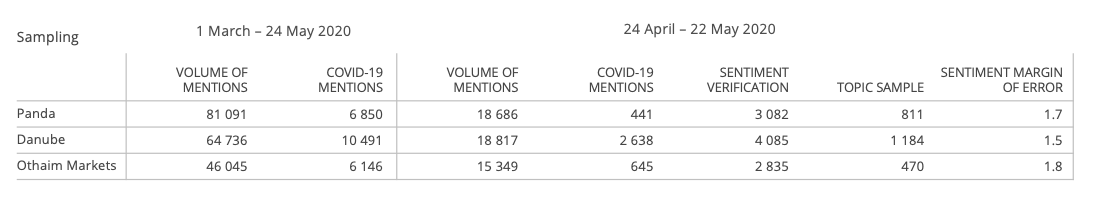
This analysis used public Twitter data. The date range for the volumetric analysis section is 1 March – 24 May 2020. For the sentiment and topics analysis, the date range is 24 April – 22 May 2020. The conversation about COVID-19 was segmented through a keyword filter.
To carry out a sentiment analysis with a 95% confidence level, a random sample of 10 002 tweets were processed through DataEQ’s Crowd of human contributors for evaluation and verification. The Crowd assigned tweets sentiment scores of positive, negative or neutral. Topic analysis enables a granular understanding of the specific themes driving consumer sentiment. A sample of 2 465 sentiment-bearing mentions (only positive and negative) was sent to the Crowd, who identified which of the 62 pre-defined retail topics were contained in each tweet.